 simhood
- dashboard
- simulation
- economy
Watching the town think
Before the 3D view existed there was the dashboard: a web page that draws the running simulation from above and lets you poke at it. For the first year it is the game. This entry explains what the simulation underneath is doing, then walks through the dashboard as it stood when the town got its budget, its moods and its pollution.
The screenshots come from that town, seed 1, three weeks into its first January, taken on 10 October.
What is being simulated
simhood is a city builder where the depth is in how a town lives, not in its traffic. The town in these shots has about 2,000 residents, and each one is a real agent, not a statistic:
- People and households. Everyone has a name, an age and a household: a single person, a couple, a family, a single parent or sharers, in the proportions found in England and Wales. Names fit each person’s background and birth year.
- Days and trips. Every morning each resident plans their day (home, work, the shops, home again) and travels it on foot or by car along real streets. Busy streets slow everyone down.
- Jobs and wages. Firms hire residents, lay them off when they need fewer staff and pay wages once a month. Some people are always looking for work, and some jobs are always open.
- Shops and prices. A farm grows produce, grocers turn it into groceries, hairdressers and other services serve residents, and offices sell services to the outside world. Every day each market clears: buyers bid, sellers offer, and shortages are shared out fairly. Prices aren’t set by a script. A shop that keeps selling out raises its price, and one with stock left over lowers it.
- Money that adds up. Every payment goes through a ledger, and money is never made or lost by accident. Every day the simulation checks that every coin in town is still accounted for.
- Homes and rent. Every home has an owner. About five in eight households own theirs, the rest rent from a local landlord and pay at the start of every month, and the rent is set when a tenancy starts or renews.
- A council budget. The town collects council tax and, if you set one, a sales tax, and it spends the money on public services, including the council’s own jobs. It never borrows: when the money runs out, services fall short.
- Mood and pollution. Each resident has a mood out of 1,000 that follows how well fed, rested, connected and financially secure they are, and whether they have work. Traffic and firms give off nitrogen oxides that drift over nearby streets. Homes on polluted streets rent for a little less, and shoppers lean towards cleaner parts of town.
The same seed gives the same town
The whole simulation is deterministic. The same seed, settings and actions give exactly the same town and the same year on any computer, operating system or number of processor cores, down to the last coin. That’s checked automatically, and a saved game carries on exactly as if it had never stopped.
This matters for two reasons. For research and teaching, a result can be repeated: if raising a tax lowers mood in one run, anyone can rerun that town and get the same numbers, and two runs can be compared to find the exact moment they part ways. For players it’s about fairness: a shared town or challenge plays the same for everyone, and the camera, the game speed or a faster computer never change what happens.
The town, live
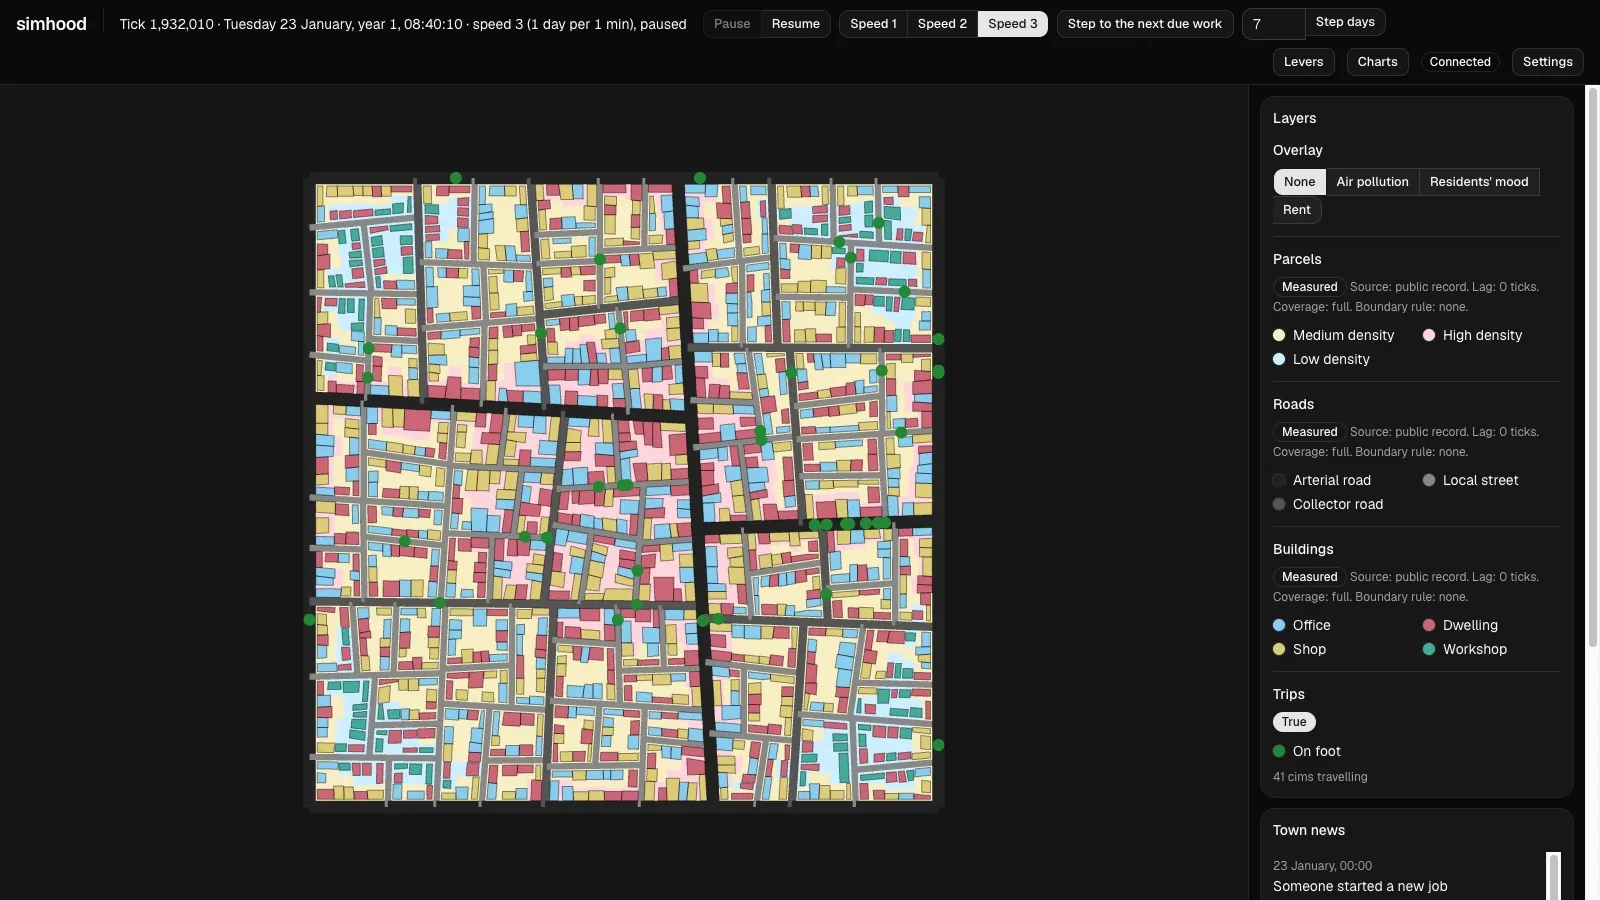
A Tuesday morning at 08:40. Buildings are coloured by use (red homes, yellow shops, blue offices, teal workshops), and each green dot is a resident on their way somewhere, 41 of them right now. The dots follow the routes the simulation actually planned.
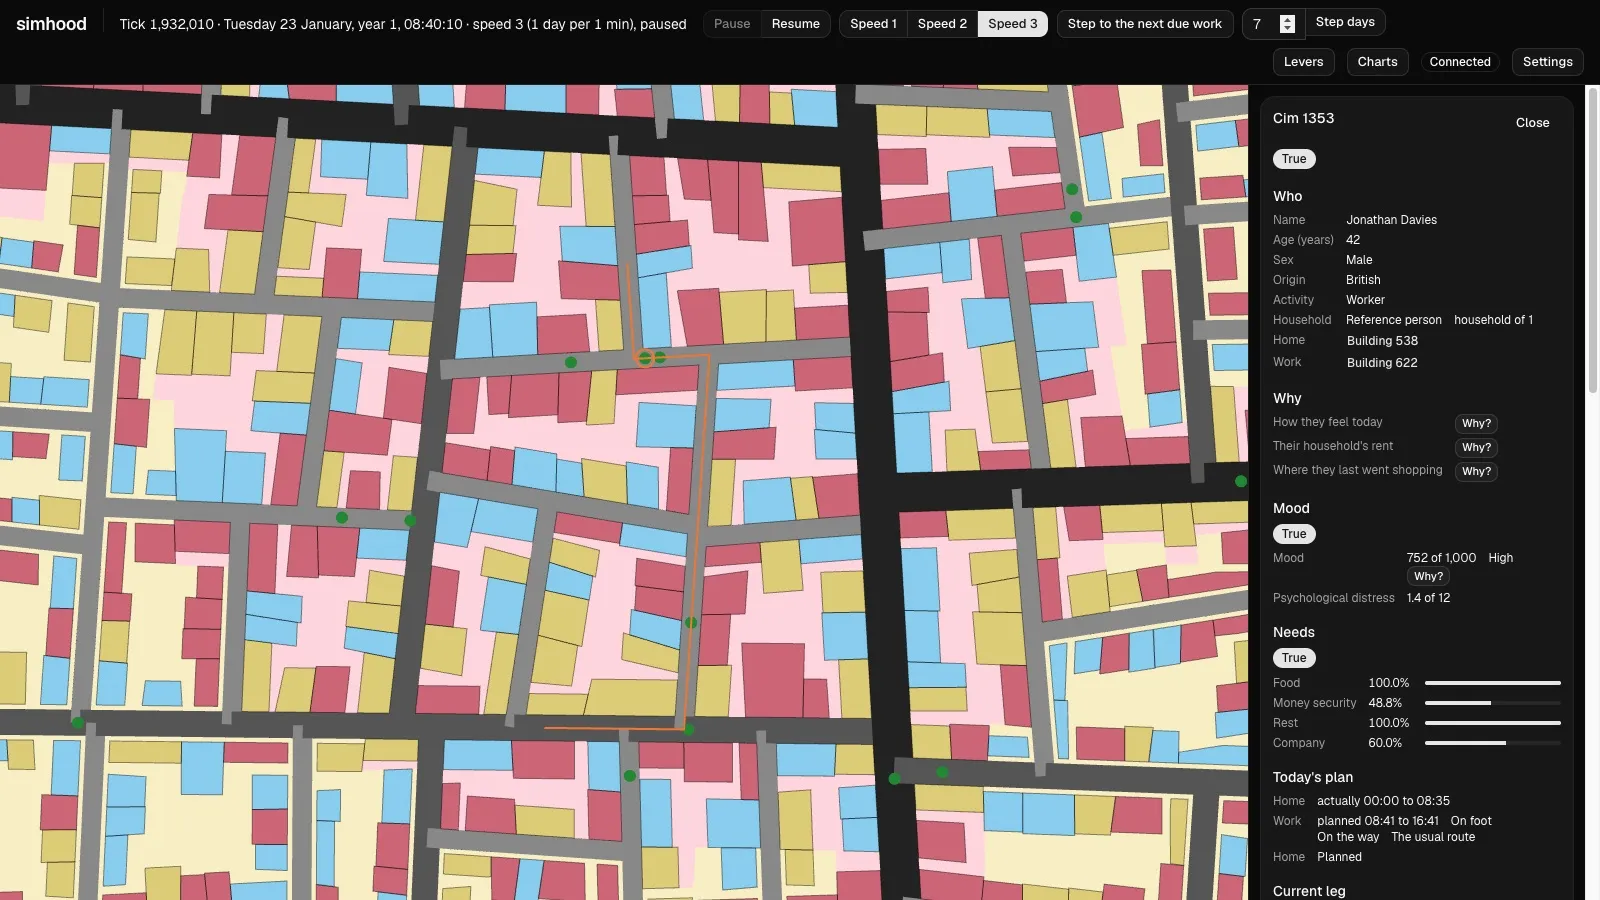
Click a dot and you get the person. This is Jonathan Davies, 42, who lives alone and is walking his usual route to work (in orange). His card shows his mood (752 of 1,000), how well each need is met (well fed and rested, money worries at 48.8%) and today’s plan. Every building, road and plot has a card too, and a link opens the same selection for anyone you share it with.
Charts
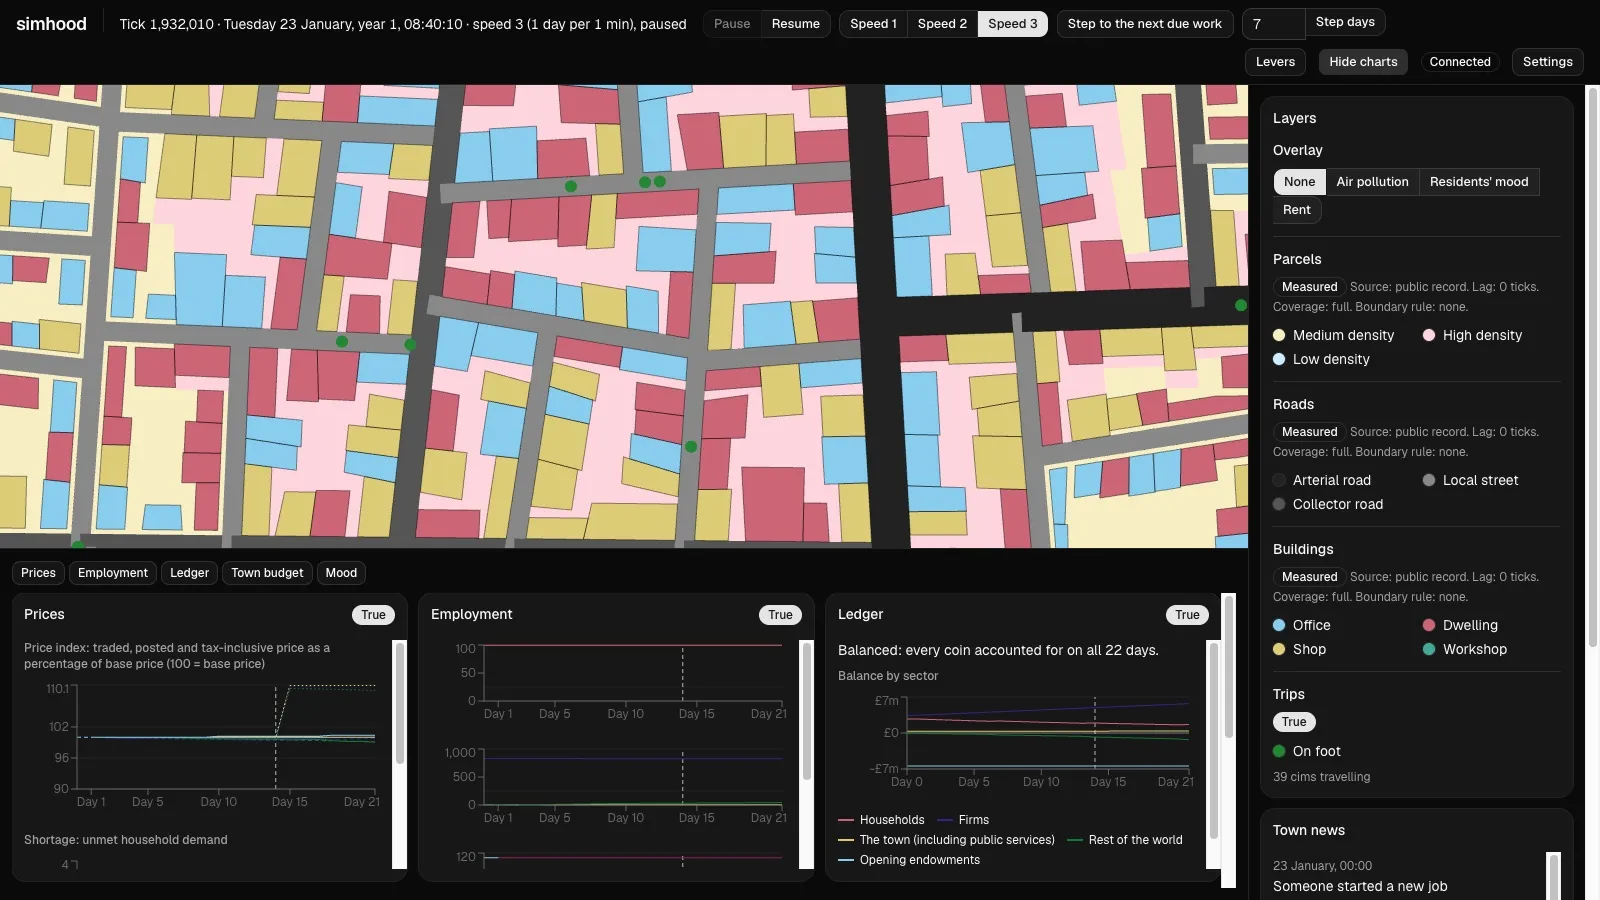
The charts panel. The dashed line on day 15 marks a lever change: a 10% sales tax. On the prices chart the tax-inclusive price jumps the next morning, while the price shops ask hardly moves. The ledger chart says it plainly: every coin accounted for on all 22 days.
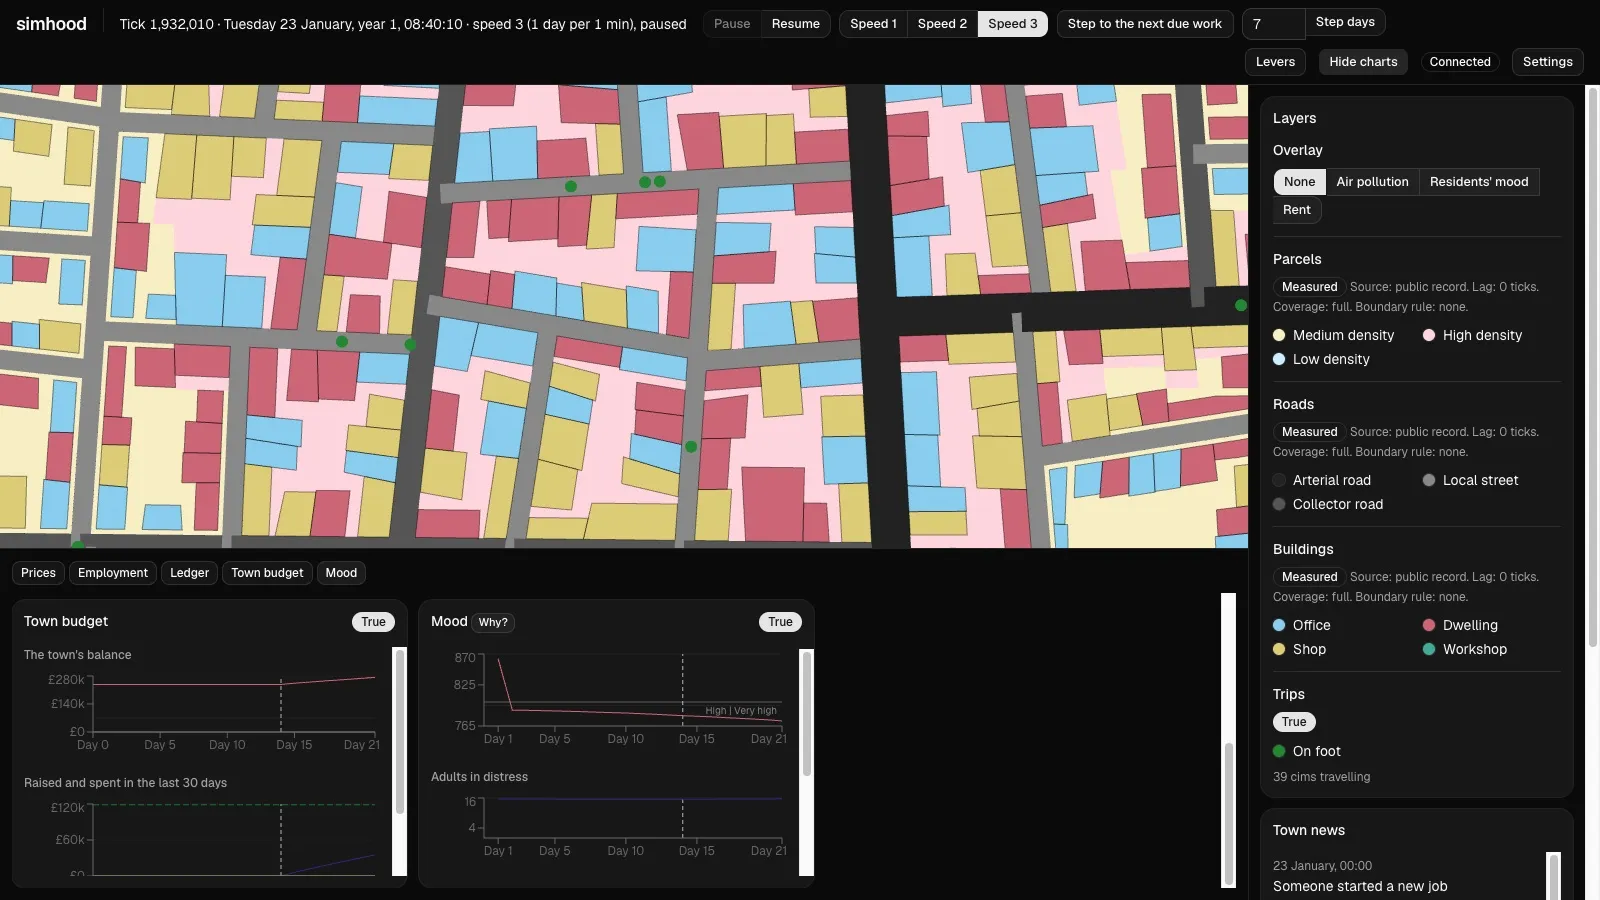
The town’s budget and residents’ mood. The budget’s balance starts climbing once the sales tax comes in. Mood falls fast in the first days as the starting town settles, then drifts.
Levers
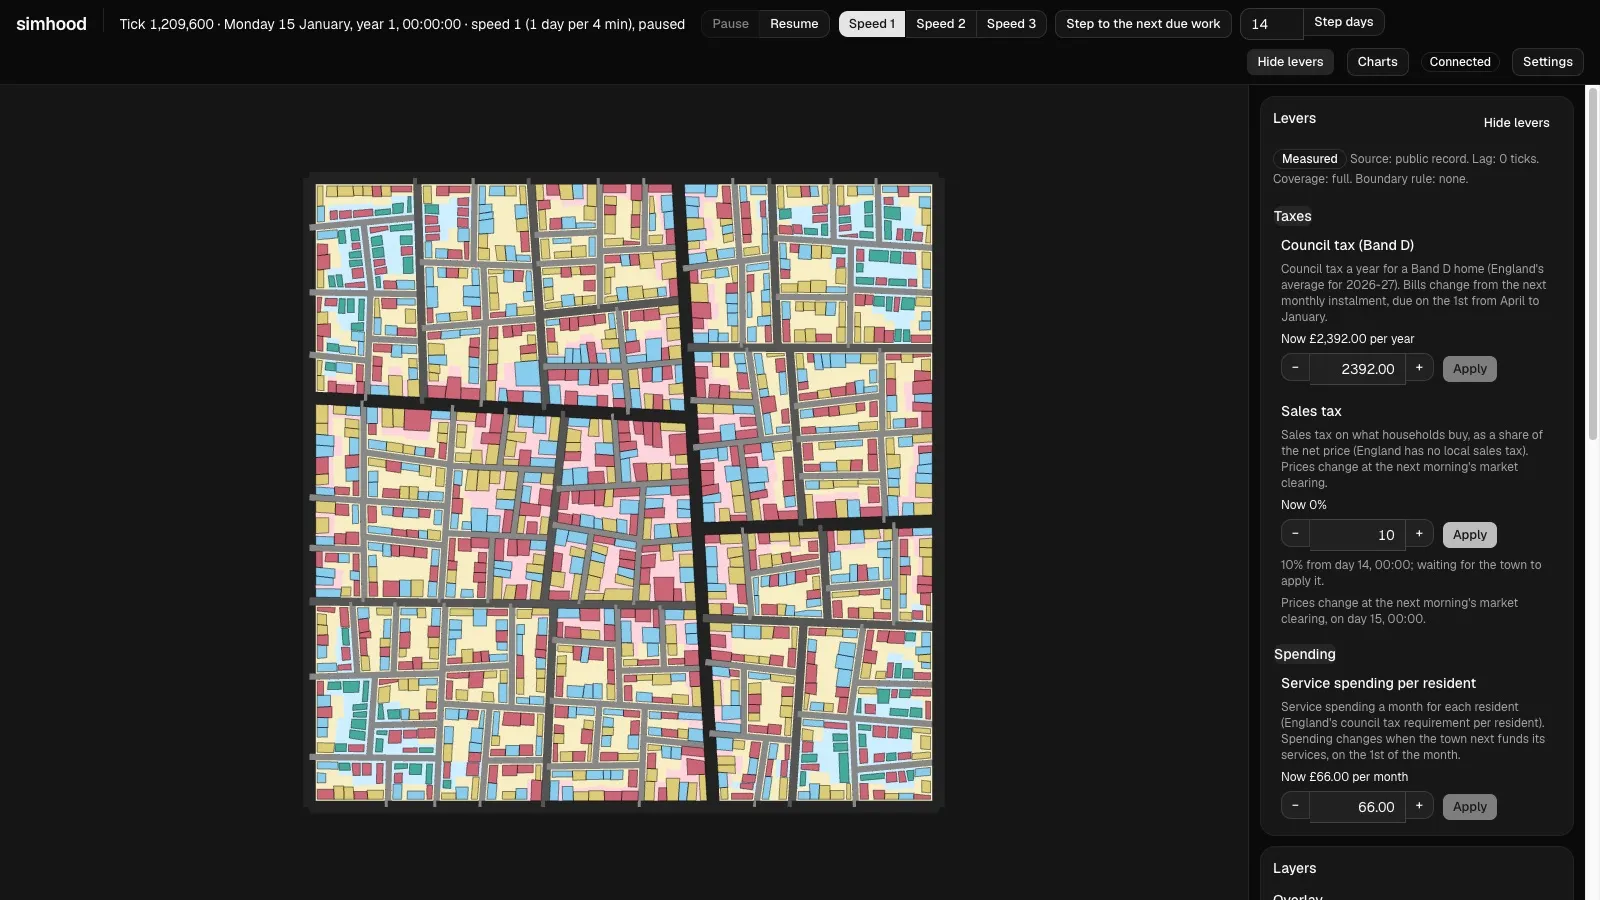
The levers: council tax, sales tax and spending on public services per resident. Type a value and press Apply. Until the town applies it, the panel says the change is waiting and when it will show (prices at the next morning’s market, council tax and spending on the 1st of the month), and the town news reports that the council changed it.
Asking why
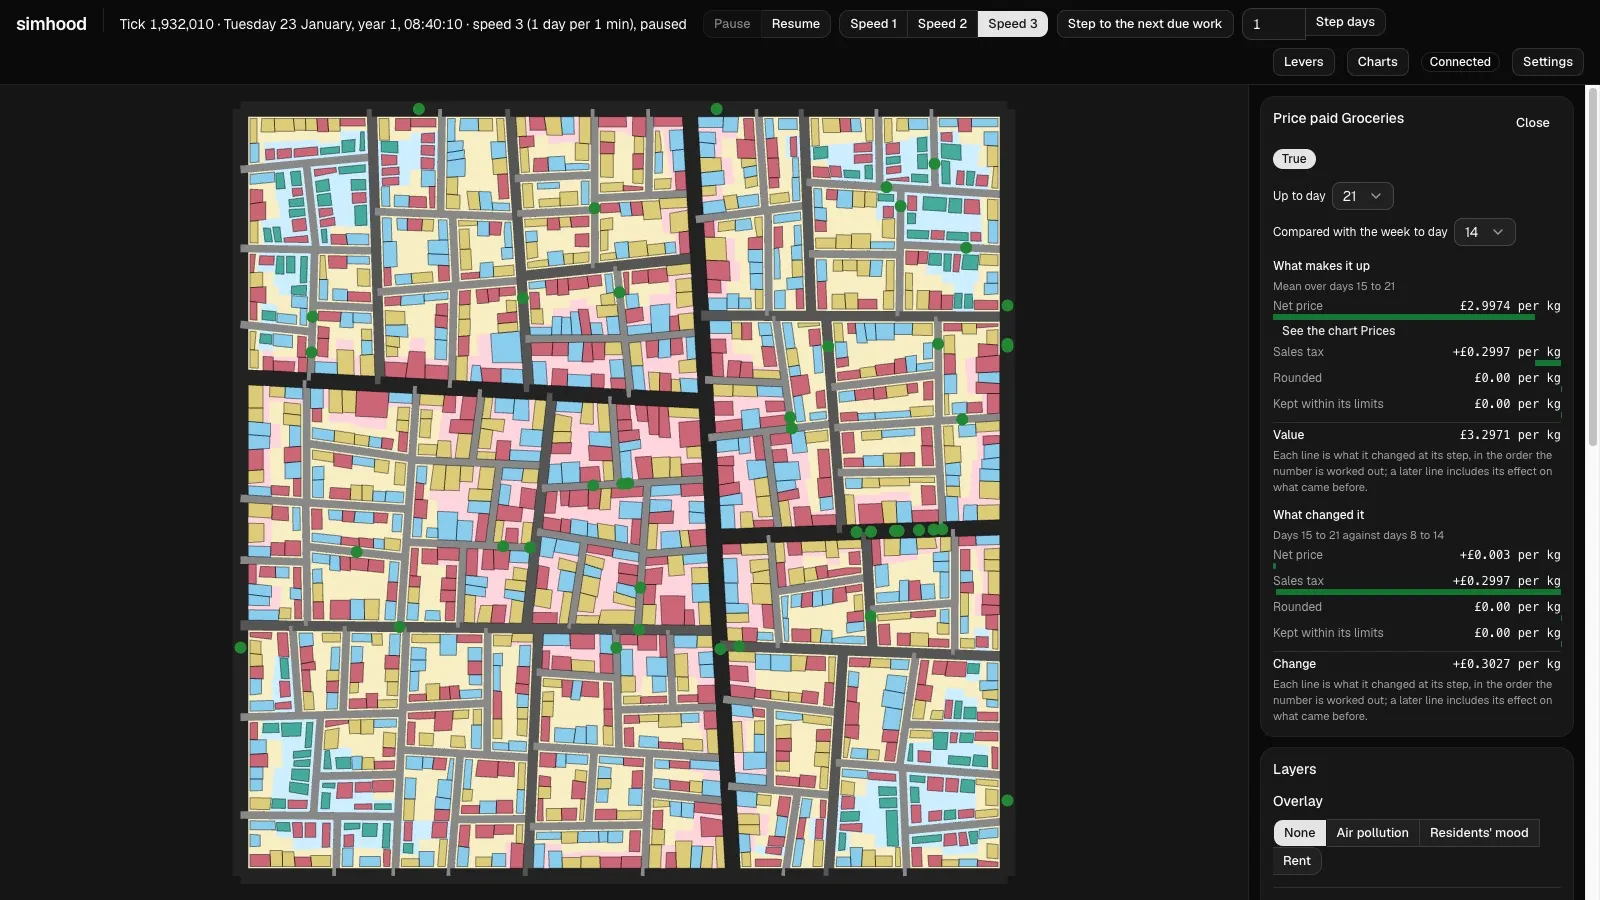
The why panel, here for the price paid for groceries in the week after the tax. It lists what makes the number, step by step (a net price of about £3.00 a kilo plus 30p of sales tax), and what changed it against the week before: almost all of the 30p rise is the tax. Each line links on to the number behind it, so you can follow a resident’s mood down to the prices they pay and the tax on them.
A Why button sits beside prices, mood and rent everywhere they appear, including a resident’s card: why they feel as they do today, why their household pays its rent, why they chose their last shop.
Overlays
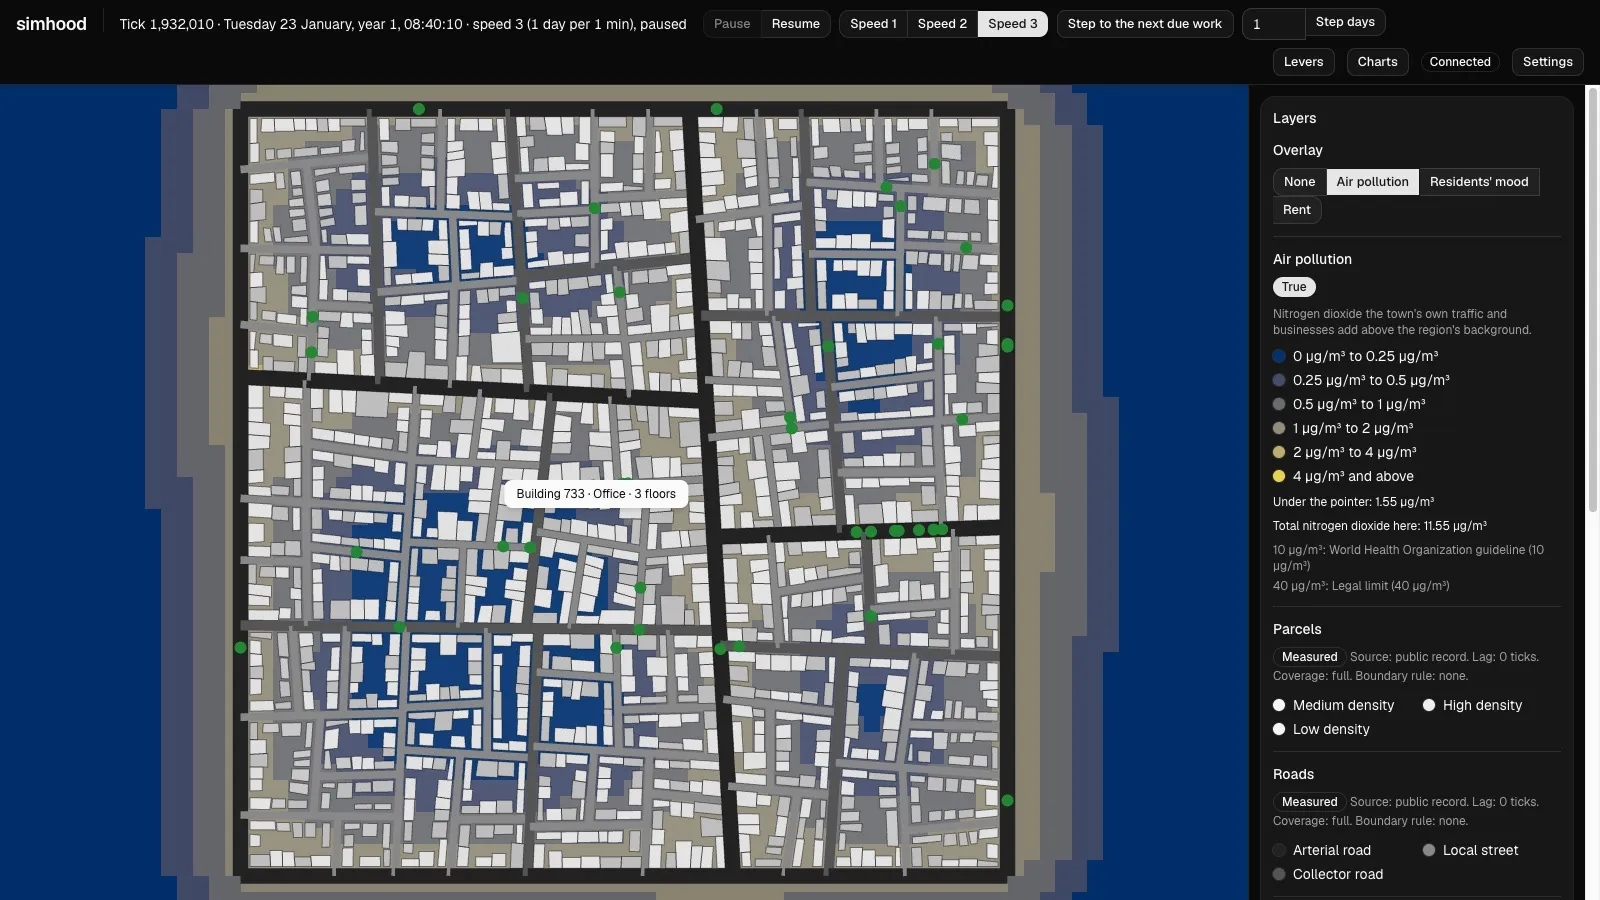
Air pollution: nitrogen dioxide in µg/m³, with the World Health Organization guideline and the legal limit marked in the legend. Most of what you see is the background level. The town’s own traffic and firms add a little along the busy roads.
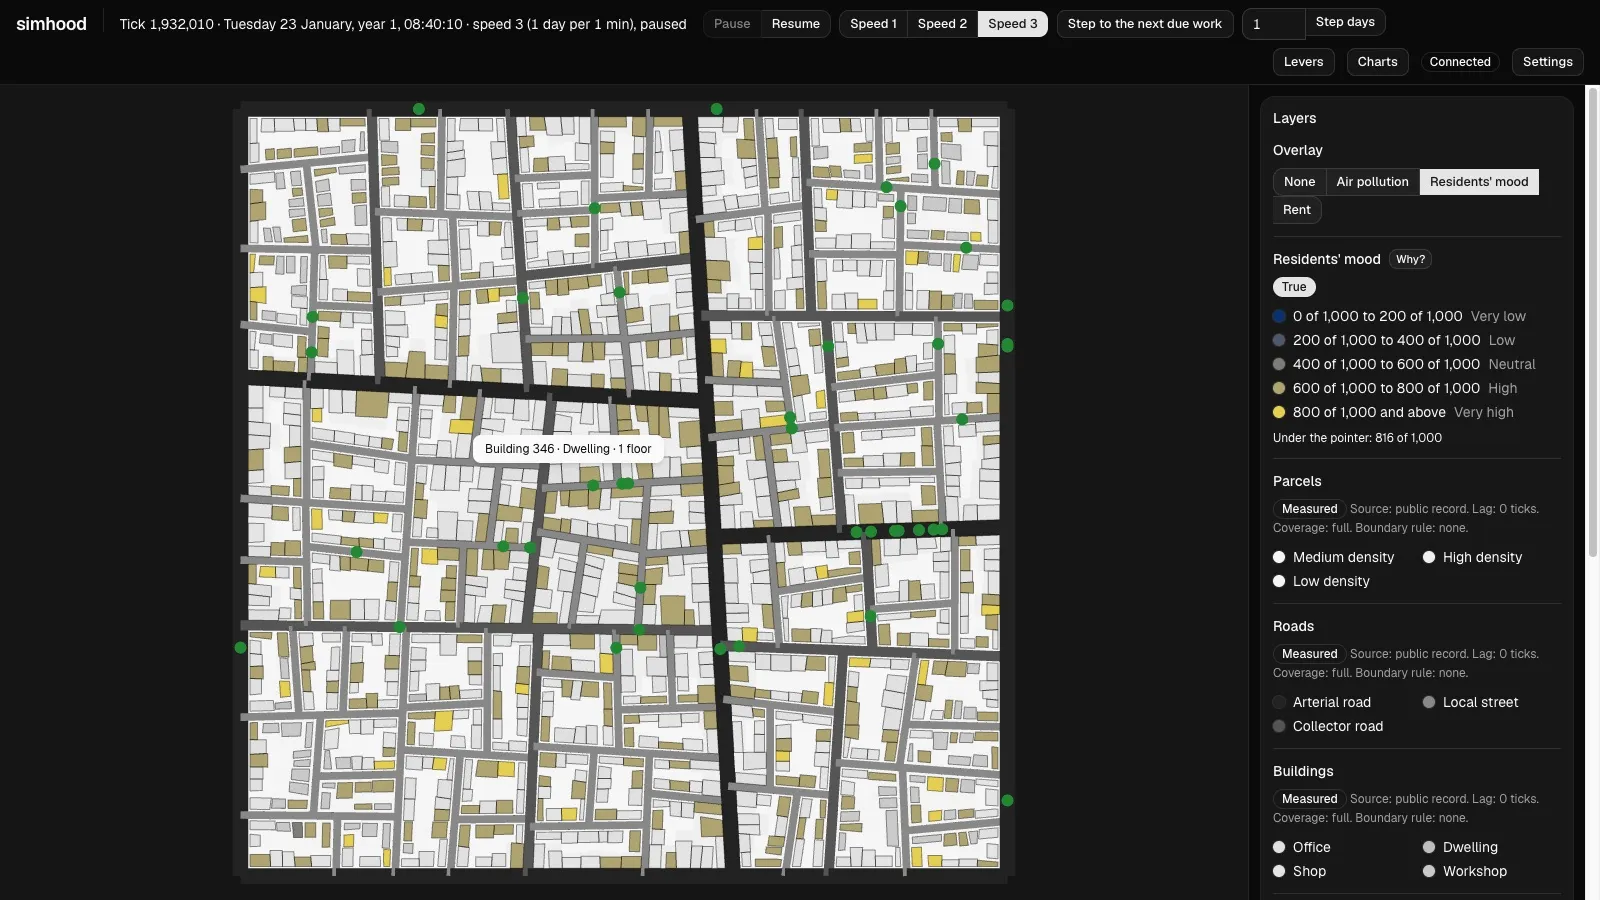
Residents’ mood, building by building. This one reads 816 of 1,000.
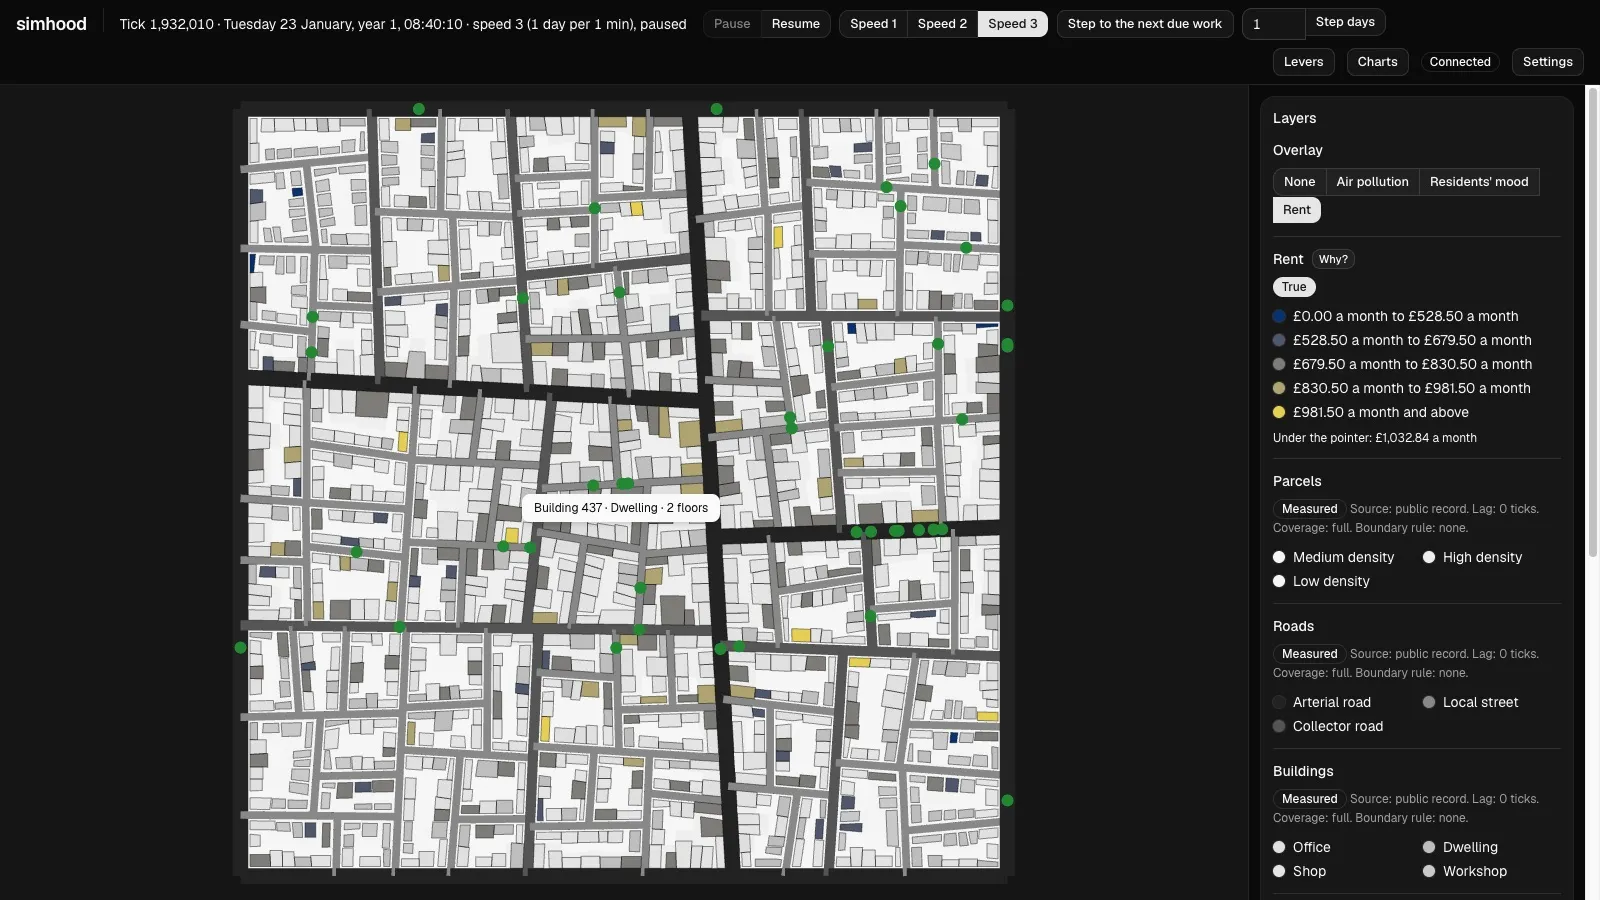
Rent, in pounds a month. The home under the pointer rents for £1,032.84.
What we measured
With the tax lever we checked, over the town’s full year, that the parts really connect. A 10% sales tax raises shop prices 10% from the next morning, cuts what households spend on household goods by about 10 to 14%, and lowers average mood by about 13 points. The town’s overall price index rises only about 6%, because rent and imported goods aren’t taxed. The why panel names the tax as the cause.
Pollution leaves its mark on rents: about 96% of new or renewed tenancies carry a small pollution discount, averaging 0.4%.
What’s early
- The map is flat colour from above: no land, no water, no buildings with height. That’s what the 3D view is for.
- The levers are only three, and they change slowly. Most of what a town needs to react to (people moving in and out, births and deaths, elections) isn’t simulated yet.
- The town’s numbers aren’t fully tuned. Employment runs a little high, partly because the council hires locals without the town attracting any new workers.
- The charts are dense and built for checking the simulation more than for enjoying it. Making the dashboard pleasant to play with comes later, after a first real 20-minute session with the levers.